Hi,
Since the point I found about the Heart equation, which is just an equation that when you plot shows the shape of heart, I was wondering what type of pictures one could create using just math symbols. Of course, when you have function you are quite limited since there cannot be two x’s above each other. In equation, it is better since you are not limited by this but functions like logarithm or sinus are not made for drawing pictures, usually just curves. I thought that anything more complicated would be basically impossible to figure out, until I found the Tupper’s self-referential formula.
It is just completely “epic” and here is how it looks: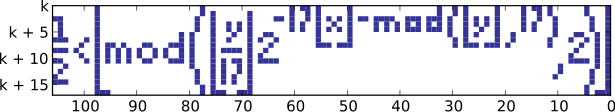
There are two things that you might have noticed. It is a plot, that is quite simple and yeah, this formula plots itself. When I first saw I could not believe my eyes though later I found out that it is quite fake.
What you see up there is plotted function but not smoothly, rather using the mod function and bunch of rounding to get actual pixels. This is quite cool idea. You can notice one more thing, there is no number specified on the y-axis. Therefore, the function loses some of its uniqueness.
The role of this function is to convert bitmap aka picture of the size 17×106 to constant k. For this special case k is very big number, this one:
960 939 379 918 958 884 971 672 962 127 852 754 715 004 339 660 129 306 651 505 519 271 702 802 395 266 424 689 642 842 174 350 718 121 267 153 782 770 623 355 993 237 280 874 144 307 891 325 963 941 337 723 487 857 735 749 823 926 629 715 517 173 716 995 165 232 890 538 221 612 403 238 855 866 184 013 235 585 136 048 828 693 337 902 491 454 229 288 667 081 096 184 496 091 705 183 454 067 827 731 551 705 405 381 627 380 967 602 565 625 016 981 482 083 418 783 163 849 115 590 225 610 003 652 351 370 343 874 461 848 378 737 238 198 224 849 863 465 033 159 410 054 974 700 593 138 339 226 497 249 461 751 545 728 366 702 369 745 461 014 655 997 933 798 537 483 143 786 841 806 593 422 227 898 388 722 980 000 748 404 719
If you use the number in some internet program it will be reversed, so that is why the axis on the picture are reversed. Since the formula maps all possible bitmaps of the size mentioned, it is just extremely long graph containing every possible option, even itself. This is interesting in its own way though it is not anymore very “self-referential”, it is like if you would make a program creating all possibilities of 10000 characters long string. It would also contain the code itself though there is nothing special about it.
Click here to see the beginning of the graph.
Dragallur
Picture source: By Larske – Own work, CC BY-SA 3.0, https://commons.wikimedia.org/w/index.php?curid=22421657